Homemade oscilloscope on a microcontroller pic. Dual channel USB oscilloscope
This simple and cheap USB oscilloscope was invented and made just for fun. A long time ago I had the opportunity to repair some murky video processor in which the input was burned down to the ADC. ADCs turned out to be available and inexpensive, I bought a couple just in case, one was used as a replacement, and the other remained. Recently it caught my eye and after reading the documentation for it, I decided to use it for something useful on the farm. In the end, we got this little device. It cost me a penny (well, about 1000 rubles), and a couple of days off. When creating, I tried to reduce the number of parts to a minimum, while maintaining the minimum functionality required for an oscilloscope. At first I decided that the result was some kind of painfully frivolous device, however, now I use it constantly, because it turned out to be very convenient - it does not take up space on the table, easily fits in a pocket (it is the size of a pack of cigarettes) and has quite decent characteristics:
Maximum sampling frequency - 6 MHz;
- Input amplifier bandwidth - 0-16 MHz;
- Input divider - from 0.01 V/div to 10 V/div;
- Input resistance - 1 MOhm;
- Resolution - 8 bits.
For various settings and troubleshooting in all sorts of power converters, control circuits for household appliances, for studying all kinds of devices, etc., where precise measurements and high frequencies are not required, but you just need to look at the waveform with a frequency of, say, up to a couple of megahertz - more than enough.

The S2 button is part of the hardware needed for the bootloader. If you keep it pressed when connecting the oscilloscope to USB, the PIC will work in bootloader mode and you can update the oscilloscope firmware using the appropriate utility.
A “television” chip was used as an ADC (IC3) - TDA8708A. It is quite available in all sorts of "Chip and Dip" ahs and other places where parts are obtained. In fact, this is not only an ADC for a video signal, but also an input switch, an equalizer and a white-black level limiter, etc. But all these delights are not used in this design. The ADC is very fast - the sampling frequency is 30 MHz. In the circuit it operates at a clock frequency of 12 MHz - there is no need to go faster because PIC18F2550 It just won't be able to read the data faster. And the higher the frequency, the greater the consumption of the ADC. Instead of TDA8708A You can use any other high-speed ADC with parallel data output, for example TDA8703 or anything from Analog Devices.
The clock frequency for the ADC was cunningly extracted from the PIC - a PWM is running there with a frequency of 12 MHz and a duty cycle of 0.25. The clock pulse of positive polarity passes in the Q1 cycle of the PIC, so that with any access to port B, which occurs in the Q2 cycle, the data The ADCs will be ready. The PIC core operates at a frequency of 48 MHz, obtained through the PLL from a 4 MHz crystal. A copy command from register to register is executed in 2 clock cycles or 8 cycles. Thus, ADC data can be stored in memory at a maximum frequency of 6 MHz using a continuous sequence commands MOVFF PORTB, POSTINC0. One PIC18F2550 RAM bank of 256 bytes is used for the data buffer.
Lower sample rates are achieved by adding a delay between MOVFF commands. The firmware implements the simplest synchronization based on the negative or positive edge of the input signal. The data collection cycle into the buffer is started by a command from the PC via USB, after which this data can be read via USB. As a result, the PC receives 256 8-bit samples, which it can, for example, display as an image.
The input circuit is incredibly simple. The input voltage divider is made without any frills on a rotary switch. Unfortunately, it was not possible to figure out how to transfer the switch position to the PIC, so the graphical face of the oscilloscope contains only voltage values in relative units - scale divisions. The input signal amplifier (IC2B) operates with a gain of 10 times, the zero offset required for the ADC (it accepts a signal in the range from Vcc - 2.41V to Vcc - 1.41V) is provided by the voltage from the programmable reference voltage generator PIC (CVREF IC1, R7, R9) and a divider from the negative supply voltage (R6, R10, R8). Because There was an “extra” amplifier (IC2A) in the op-amp housing; I used it as a bias voltage follower.
Don’t forget about capacitive circuits for frequency compensation of the input capacitance of your op-amp and limiting diodes, which are missing in the diagram - you need to select capacitances parallel to the divider resistors and resistor R1, otherwise the frequency characteristics of the input circuit will ruin the entire passband. With direct current, everything is simple - the input resistance of the op-amp and closed diodes is orders of magnitude higher than the resistance of the divider, so the divider can simply be calculated without taking into account the input resistance of the op-amp. For alternating current it is different - the input capacitance of the op-amp and diodes is a significant amount compared to the capacitance of the divider. From the resistance of the divider and the input capacitance of the op-amp and diodes, a passive low-pass filter is obtained, which distorts the input signal.
To neutralize this effect, you need to make sure that the input capacitance of the op-amp and diodes becomes significantly less than the divider capacitance. This can be done by constructing a capacitive divider parallel to the resistive one. It is difficult to calculate such a divisor, because Both the input capacitance of the circuit and the mounting capacitance are unknown. It's easier to pick it up.
The selection method is as follows:
1. Place a capacitor with a capacity of approximately 1000 pF in parallel with R18.
2. Select the most sensitive limit, apply rectangular pulses with a frequency of 1 kHz and a swing of several scale divisions to the input, and select a capacitor parallel to R1 so that the rectangles on the screen look like rectangles, without peaks or valleys at the fronts.
3. Repeat the operation for each subsequent limit, selecting capacitors in parallel with each divider resistor according to the limit.
4. Repeat the process from the beginning, and make sure that everything is in order at all limits (the capacitance of the capacitor installation may appear), and, if something is wrong, slightly adjust the capacitances.
The op amp itself is Analog Devices AD823. The most expensive part of the oscilloscope. :) But the band is 16 MHz - which is not bad. And besides, this is the first of the fast ones that came across in retail sale for reasonable money.
Of course, this dual op-amp without any modifications can be changed to something like LM2904, but then you will have to limit yourself to audio signals. It will not handle more than 20-30 kHz.
Well, the shape of rectangular signals, for example, will be slightly distorted. But if you can find something like OPA2350(38 MHz) - on the contrary, it will be wonderful.
The negative supply voltage source for the op-amp is made using the well-known charge-pump ICL7660. Minimum wiring and no inductances. Of course, its output current is -5 V, which is small, but we don’t need much. The power circuits of the analog part are isolated from digital noise by inductances and capacitances (L2, L3, C5, C6). The inductors came with a nominal value of 180 uH, so I installed them. No power interference even at the most sensitive limit.
The PIC firmware is uploaded via USB using a bootloader that sits at address 0 in the program memory and starts if you hold down the S2 button when turning it on. So before flashing the PIC, upload the bootloader there first - it will be easier to change the firmware.
When setting up assembled electronic circuits, especially digital ones, various measurements may be necessary. To do this, you can use various probes, for example, a logic probe, the simplest one, consisting of an LED, a current-limiting resistor, and wires ending with a probe at one end and a crocodile at the other. With its help, we can verify whether we have a logical one or zero, for example, on the MK pin or Arduino pin. I decided to go further, to assemble something that I think will interest many beginners in its ease of assembly, will allow them to gain useful knowledge from theory, look at the waveform, for example, what it looks like when the same LED blinks, and of course they can check the presence of a logical zero or units, on the stem of the MK. In general, I decided to assemble a simple oscilloscope probe, connected to a computer via a USB port.
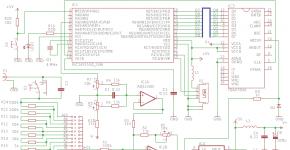
This scheme is a foreign development, from where it later migrated to the Runet and spread across many sites. In search of detailed information when assembling it, I visited many sites, at least 10-12. All of them had only a short description, translated and ripped from a foreign site, and firmware for downloading, with an example of setting fuses. Below is a diagram of this oscilloscope probe:

I deliberately do not call it a pure oscilloscope, because it does not live up to this title. Let's take a closer look at what it is. The budget of the device is only 250, maximum 300 rubles, and any schoolchild or student can afford to assemble it. As a visual aid for practicing soldering skills, flashing MK, in general, for practicing all the skills necessary for independent design of digital devices. If someone immediately caught fire and was about to immediately run to the store to buy radio components, wait, this oscilloscope probe has several significant disadvantages. It has very inconvenient software, a shell in which we will actually observe our signal. The following photo shows how I catch momeha from my finger:

To say that the shell is crude is to say nothing... Even shells for use as a low-frequency oscilloscope on a sound card significantly surpass it in their capabilities. In the next photo, I briefly touch the battery terminals with the probes:

Let's start with the fact that our readings are displayed in millivolts, and there is simply no voltage scale corresponding to real values. But that's not all. The circuit diagram of the device, as we can see by looking at the figure with the circuit, is based on the Tiny 45 MK.
 This device does not use an external high-speed ADC, and this is its significant drawback. This means that when measuring a signal with a frequency for which our oscilloscope probe is not designed, we will get just a straight line on the screen... Recently I needed to repair a remote control, diagnostics showed that the power was coming in, and the tracks were all intact, and the contacts on the board, along with the rubber buttons, were cleaned, all to no avail, the remote control showed no signs of life. At a local radio forum, I was offered to replace the ceramic resonator, which, by the way, had no cracks or any other external signs that would indicate that the part was faulty. I decided to listen to the advice, went to the store and bought a new 455 kHz ceramic resonator, costing only 5 rubles, resoldered it, and the remote control immediately “came to life”.

Why am I telling this? And besides, after assembling this probe, the idea came to me to check the generation of a clock signal on the remote control. Not so. The oscilloscope probe showed a conditionally low level on one leg of the resonator, a high level on the other, and drew a straight line. Not even able to cope with the frequency of 455 kHz... Now that you have been warned about its disadvantages, you can decide for yourself whether you need such an oscilloscope probe. If yes, then continue reading)... The input impedance of both channels of the oscilloscope is 1 MOhm.

For this purpose, we will need to purchase and solder 1 MOhm trimming resistors and a 1/10 signal divider. Accordingly, the divider resistances should be 900 and 100 KiloOhms. I decided to use 2 channels of the oscilloscope, since there was a connector available - sockets soldered on the board, two tulips, and the difference in the cost of the parts for me was, in fact, only the cost of the trimming resistor. Another thing is that both channels turned out to be not identical in their readings. As we see in the diagram, one channel was designed to work with a divider, and the other was not. Well, it doesn’t matter, if we need this channel to work without a divider, we just need to unscrew the position of the trimmer resistor slider to zero, thereby sending a signal from the output directly to the MK leg. This can be useful when measuring signals on two lines with low amplitude. The following photo shows how I remove the signal from the multivibrator:

We can also, by turning the trimmer resistor knob, set which divider we need, 1\10, 1\25, 1\50, 1\100, or any other, by measuring the resistance with a multimeter between the central terminal and the outer terminals of the trimming resistor. This may be required to measure waveforms with large voltage amplitudes. To do this, you will only need to calculate the resulting ratios of the divider resistances. There is one more important nuance: on the foreign website of the author of the circuit, when selecting fuses, it is indicated that you need to set the fuse - the Reset Disable bit to the on position. As we remember, turning off this fuse bit stops the possibility of sequential programming. The fuses that need to be changed are shown in the following figure:

In this circuit, Pin 1 Reset is not used as a Pin, so we do not need to change this fuse bit. But on one of the forums, for more stable operation of the oscilloscope probe, they recommended connecting Pin Reset through a 10 kiloOhm resistor to the power supply positive, which is what I did. Also, when I was looking for information on it, on none of the sites I found a clear and accessible explanation about the source of clocking of the Tiny 45 MK. So, in this circuit, the MK is clocked not from the internal RC oscillator, not from a quartz resonator, but from external clock signal supplied to the MK from the USB port. It is logical to assume that by selecting this clock source, the MK will no longer be visible to us in the flashing shell when disconnected from the USB port, so first upload the firmware, and then carefully set the fuse bits.

Let's look at the oscilloscope circuit in more detail; 68 Ohm matching resistors are installed on the signal lines of the USB ports D+ and D-. I do not recommend changing their denomination. It is recommended to install 100 nanoFarad ceramic capacitors between the signal conductors and ground to reduce interference. The same 100 nanoFarad capacitor must be installed in parallel with the electrolytic capacitor, 47 microFarad, installed along the +5 volt and ground power circuits. Between ground and signal lines, 3.6 Volt zener diodes must be installed. I really set it to 3.3 volts, everything works fine. There is a power-on indication on an LED connected in series with a 220-470 Ohm resistor.

The rating in this case is not critical, and only the brightness of the LED depends on it. I set it to 330 Ohm, the brightness is sufficient. A resistor of 1.5-2.2 kiloOhm is installed in the circuit to detect the device by the operating system.

Solder the wires of the USB cable to the board, focusing on the cable pinout, and not on the location on the oscilloscope diagram. In the diagram, the order of the cores is indicated arbitrarily. Also, among the minor drawbacks, according to reviews from users, after restarting Windows, we will need to re-plug the oscilloscope into the USB port. Don't forget to remove the fuse bit - the clock divider bit by 8 CKDIV 8. This oscilloscope does not require any third-party drivers for its operation, and is defined as a Hid device, similar to a mouse or keyboard. When you connect for the first time, the device will be detected as Easylogger. The following figure shows a list of parts required for assembly.

There are 6 versions of the Usbscope program, the shell in which we actually observe the graph. The first three versions do not support 64-bit Windows operating systems. Starting from the fourth version of Usbscope, support is provided. For the program to work, Netframework must be installed on your computer. The source codes for the firmware and the source codes for the shell program were posted on the author’s website, so perhaps there will be craftsmen who can supplement the software. What is the practical use of this oscilloscope, is it really just a toy? No, this device is used in the car industry by home craftsmen, as a budget replacement for an expensive oscilloscope, for setting up car ignition systems, fuel consumption and similar needs.

Apparently the frequency of work in the car industry is quite low, and this probe is minimally enough, at least for one-time work. To connect to the circuit being measured, I soldered two probes, using, in order to reduce the level of interference, a shielded wire, tulips or an RCA connector. This makes it easy to connect and disconnect probes from the oscilloscope.

- One of the wires - the oscilloscope probes, ends for measurement with a multimeter probe for the signal core, and with a crocodile clip for connecting to the ground.
- The second probe ends with crocodiles of different colors, both for the signal core and for the ground.
Conclusion: assembling this probe is advisable, rather as a visual aid, for studying the shape of low-frequency signals. For practical purposes, for example, for testing and tuning switching power supplies, in particular the operation of PWM controllers, this probe is definitely not suitable, since it cannot provide the required speed. Therefore, it cannot be a replacement for even the simplest Soviet oscilloscope, or even simple oscilloscopes from Ali Express.
You can download the archive with the circuit diagram, firmware, fuses screen and shell of the oscilloscope probe using the link. Good luck to everyone, especially for - AKV.
Discuss the article USB OSCILLOSCOPE PROBE
This simple and cheap USB oscilloscope was invented and made just for fun. A long time ago I had the opportunity to repair some murky video processor in which the input was burned down to the ADC. ADCs turned out to be available and inexpensive, I bought a couple just in case, one was used as a replacement, and the other remained.
Recently it caught my eye and after reading the documentation for it, I decided to use it for something useful on the farm. In the end, we got this little device. It cost me a penny (well, about 1000 rubles), and a couple of days off. When creating, I tried to reduce the number of parts to a minimum, while maintaining the minimum functionality required for an oscilloscope. At first I decided that the result was some kind of painfully frivolous device, however, now I use it constantly, because it turned out to be very convenient - it does not take up space on the table, easily fits in a pocket (it is the size of a pack of cigarettes) and has quite decent characteristics:
Maximum sampling frequency - 6 MHz;
- Input amplifier bandwidth - 0-16 MHz;
- Input divider - from 0.01 V/div to 10 V/div;
- Input resistance - 1 MOhm;
- Resolution - 8 bits. The circuit diagram of the oscilloscope is shown in Figure 1.
For various settings and troubleshooting in all sorts of power converters, control circuits for household appliances, for studying all kinds of devices, etc., where precise measurements and high frequencies are not required, but you just need to look at the waveform with a frequency of, say, up to a couple of megahertz - more than enough.
The S2 button is part of the hardware needed for the bootloader. If you keep it pressed when connecting the oscilloscope to USB, the PIC will work in bootloader mode and you can update the oscilloscope firmware using the appropriate utility. A “television” chip - TDA8708A - was used as an ADC (IC3). It is quite available in all sorts of "Chip and Dip" ahs and other places where parts are obtained. In fact, this is not only an ADC for a video signal, but also an input switch, an equalizer and a white-black level limiter, etc. But all these delights are not used in this design. The ADC is very fast - the sampling frequency is 30 MHz. In the circuit, it operates at a clock frequency of 12 MHz - there is no need to go faster, because the PIC18F2550 simply will not be able to read data faster. And the higher the frequency, the greater the consumption of the ADC. Instead of the TDA8708A, you can use any other high-speed ADC with parallel data output, for example the TDA8703 or something from Analog Devices.
The clock frequency for the ADC was cunningly extracted from the PIC - a PWM is running there with a frequency of 12 MHz and a duty cycle of 0.25. The clock pulse of positive polarity passes in the Q1 cycle of the PIC, so that with any access to port B, which occurs in the Q2 cycle, the data The ADCs will be ready. The PIC core operates at a frequency of 48 MHz, obtained through the PLL from a 4 MHz crystal. A copy command from register to register is executed in 2 clock cycles or 8 cycles. Thus, ADC data can be stored in memory at a maximum frequency of 6 MHz using a continuous sequence commands MOVFF PORTB, POSTINC0. One PIC18F2550 RAM bank of 256 bytes is used for the data buffer.
Lower sample rates are achieved by adding a delay between MOVFF commands. The firmware implements the simplest synchronization based on the negative or positive edge of the input signal. The data collection cycle into the buffer is started by a command from the PC via USB, after which this data can be read via USB. As a result, the PC receives 256 8-bit samples, which it can, for example, display as an image. The input circuit is incredibly simple. The input voltage divider is made without any frills on a rotary switch. Unfortunately, it was not possible to figure out how to transfer the switch position to the PIC, so the graphical face of the oscilloscope contains only voltage values in relative units - scale divisions. The input signal amplifier (IC2B) operates with a gain of 10 times, the zero offset required for the ADC (it accepts a signal in the range from Vcc - 2.41V to Vcc - 1.41V) is provided by the voltage from the programmable reference voltage generator PIC (CVREF IC1, R7, R9) and a divider from the negative supply voltage (R6, R10, R8). Because There was an “extra” amplifier (IC2A) in the op-amp housing; I used it as a bias voltage follower.
Don’t forget about capacitive circuits for frequency compensation of the input capacitance of your op-amp and limiting diodes, which are missing in the diagram - you need to select capacitances parallel to the divider resistors and resistor R1, otherwise the frequency characteristics of the input circuit will ruin the entire passband. With direct current, everything is simple - the input resistance of the op-amp and closed diodes is orders of magnitude higher than the resistance of the divider, so the divider can simply be calculated without taking into account the input resistance of the op-amp. For alternating current it is different - the input capacitance of the op-amp and diodes is a significant amount compared to the capacitance of the divider. From the resistance of the divider and the input capacitance of the op-amp and diodes, a passive low-pass filter is obtained, which distorts the input signal.
To neutralize this effect, you need to make sure that the input capacitance of the op-amp and diodes becomes significantly less than the divider capacitance. This can be done by constructing a capacitive divider parallel to the resistive one. It is difficult to calculate such a divisor, because Both the input capacitance of the circuit and the mounting capacitance are unknown. It's easier to pick it up.
The selection method is as follows:
1. Place a capacitor with a capacity of approximately 1000 pF in parallel with R18.
2. Select the most sensitive limit, apply rectangular pulses with a frequency of 1 kHz and a swing of several scale divisions to the input, and select a capacitor parallel to R1 so that the rectangles on the screen look like rectangles, without peaks or valleys at the fronts.
3. Repeat the operation for each subsequent limit, selecting capacitors in parallel with each divider resistor according to the limit.
4. Repeat the process from the beginning, and make sure that everything is in order at all limits (the capacitance of the capacitor installation may appear), and, if something is wrong, slightly adjust the capacitances.
The op amp itself is an Analog Devices AD823. The most expensive part of the oscilloscope. :) But the band is 16 MHz - which is not bad. And besides, this is the first of the fast ones that came across in retail sale for reasonable money.
Of course, this dual op-amp can be replaced without any modifications with something like LM2904, but then you will have to limit yourself to audio signals. It will not handle more than 20-30 kHz.
Well, the shape of rectangular signals, for example, will be slightly distorted. But if you manage to find something like OPA2350 (38 MHz), then it will be, on the contrary, wonderful.
The negative supply voltage source for the op-amp is made using the well-known charge-pump ICL7660. Minimum wiring and no inductances. Of course, its output current is -5 V, which is small, but we don’t need much. The power circuits of the analog part are isolated from digital noise by inductances and capacitances (L2, L3, C5, C6). The inductors came with a nominal value of 180 uH, so I installed them. No power interference even at the most sensitive limit. The PIC firmware is uploaded via USB using a bootloader that sits at address 0 in the program memory and starts if you hold down the S2 button when turning it on. So before flashing the PIC, upload the bootloader there first - it will be easier to change the firmware.
The sources of the oscilloscope driver for kernels 2.6.X are in the archive with the firmware. There is also a console utility for checking the functionality of the oscilloscope. Its source code is worth looking at to figure out how to communicate with the oscilloscope if you want to write your own software for it.
The program for the computer is simple and ascetic, its appearance is shown in Figures 2 and 3. Connect the oscilloscope to USB and launch qoscilloscope. Requires QT4.


Attached are all the files for the project.
We decided to take an oscilloscope to a friend. We thought for a long time... Spend 5-10 thousand for a Soviet Tseshka, or save up for a normal stuffed one, which I now have on sale
For some reason, Soviet oscilloscopes on Avita are still very expensive, and a digital oscilloscope is even more expensive. And then we thought: “Why not take a USB oscilloscope from Aliexpress?” The price is pennies, the functionality is almost the same as that of a digital oscilloscope, and the dimensions are small. A USB oscilloscope is essentially also a digital oscilloscope, but with only one difference - it does not have its own display.
We scratched our heads and thought about it... The crisis will last for a long time. The dollar is not going to get cheaper. The best investments are in equipment and education. Well, said and done. More than a month later, this USB oscilloscope arrived:

In addition, it came with 2 probes, a USB cable, consumables, a software disk, and a screwdriver for adjusting the probes

On one side of the oscilloscope we see two BNC connectors for connecting probes, and on the right we see two pins. These pins are a test signal generator for calibrating oscilloscope probes. One of them is ground, and the other is signal.

As we see in the photo, the maximum voltage that we can supply to the BNC connectors is 30 Volts, which is quite enough for a novice electronics engineer. The test signal generator gives us a square wave signal with a frequency of 1 Kilohertz and a swing of 2 Volts.
On the other side you can see a signal LED indicating the operation of the oscilloscope, as well as an input for a USB cable, which at the other end connects to the PC

In working order it all looks something like this:

Oscilloscope operation
After installing the software that came on the disk, we connect our oscilloscope. Driver installation begins. Then we launch the program. The program interface is simpler than a steamed turnip:

On the left is the working field itself, and on the right is the horizontal and vertical scan for the first and second channels. There is also a magic “AUTO” button, which gives us a ready-made signal on the display.
Next, click on “CH1”, which means “first channel”, since I hooked it up to the first channel connector. We attach the probe to the test pins and prepare the oscilloscope for work. We turn the screw on the probe and ensure that the oscillogram of the test signal is strictly rectangular

It should look something like this:

This is done the same way on all digital oscilloscopes. You can read how to do this.
You can also display parameters that the oscilloscope would immediately show on the monitor. These are frequency, period, average, rms, peak-to-peak voltage, etc. You can read about these parameters in this article.

Sampling frequency
Sampling frequency– this is roughly speaking, at what frequency the oscilloscope records the signal. As you know, an oscillogram is a curve or a straight line. Most often a curve. Remember how in algebra you drew the parabola graph y=x 2? If we took 3-4 points, then our graph turned out with kinks (in red circles)

And if we took more points, then the graph would actually turn out more correct and beautiful:

Everything is the same here! Only by X do we display time, and by Y - voltage.
Therefore, in order for the signal to be displayed on the display as accurately as possible, it is necessary to have as many of these points as possible. And the more points, the better and more correctly the signal shape is displayed. In this regard, they win an absolute victory.
In order to have as many points as possible, the sampling frequency should be as high as possible. Also, the sampling frequency is most often called sampling rate. Sample from English– sampling. Every digital oscilloscope has this sampling rate marked right on the body. It is indicated in MegaSamples, which means a million samples. This USB oscilloscope has a maximum sampling rate of 48 MegaSamples per second (48MSa/s). This means that in 1 second the signal is drawn (consists of) 48 million points. Now tell me, which oscilloscope will have the most correct signal? U with a sampling frequency of 500 MSa/s or our hero of the article at 48MSa/s? Same thing)
Bandwidth
Bandwidth– this is the maximum frequency after which the oscilloscope begins to show signal distortion. On this USB oscilloscope the declared bandwidth is 20 Megahertz. If we measure signals at more than 20 Megahertz, then our signals will be distorted in amplitude. Although in reality this USB oscilloscope produces a maximum of 3 Megahertz without distortion. This is not enough.
Pros of an oscilloscope
- Reasonable price and functionality. Costs several times cheaper than cool digital oscilloscopes
- Setting up and installing the software takes about 10-15 minutes
- User-friendly interface
- Small size
- Can perform operations with both direct and alternating current
- Two channels, that is, you can measure two signals at once and display them on the display
Cons of an oscilloscope
- Low sampling rate. A small lyrical digression...
- PC required
- Low bandwidth
- Memory depth is also no
Conclusion
After the OWONa digital oscilloscope, this USB oscilloscope feels like a glamorous turd. I don’t want to say that it is generally bad and that it is better not to buy it. He is very good-looking and can produce an oscillogram according to the stated characteristics of up to 20 Megahertz, but in reality it is several times less. It cost us a little less than 4,000 rubles. If it cost around 1000-2000 rubles, then it would be worth the money. In principle, for beginner electronics engineers this oscilloscope will be a more or less normal solution. For intermediate and professional electronics engineers, I’ll say right away: “Save your money for a normal digital oscilloscope!”
Here is also a short video review from Soldering Iron:
For more information about how to choose an oscilloscope and what parameters you should pay attention to, read this article.
Measuring technologyPocket oscilloscope up to 1 MHz
By replacing the PIC16F873A microcontroller with a PIC18F4550 in the pocket oscilloscope described in , and the K140UD608 operational amplifier with a TDA8708A analog video interface chip, it was possible to reduce the sweep duration by 150 times, to 21 μs across the entire screen width, and increase the maximum input signal frequency to 1 MHz. This significantly expanded the capabilities of the oscilloscope.
Main technical characteristics
Beam deflection voltage across the entire height of the screen, V................0.2; 1; 3; 10; thirty; 100
Maximum frequency of the signal under study, MHz........1
Horizontal scan duration, μs.......21, 170, 1000, 10-103, 30-103, 100-103, 300-103, 106
Screen resolution, px......128x64
Supply voltage, V............5
Current consumption, mA...........115
Dimensions, mm......80x62x30
Weight, g........................110
The oscilloscope circuit is shown in Fig. 1. The input signal is supplied to pin 20 (ADCIN - ADC input) of the DA1 chip (TDA8708A). To launch its ADC, microcontroller DD1 generates clock pulses at pin 17. The binary codes of the signal samples are sent to port B of the DD1 microcontroller, which, according to the program, writes them into RAM and then displays them on the HG1 graphic LCD in the form of an oscillogram. A general description of the MT-12864J-2FLA LCD can be found in, and read about its use in.

Rice. 1. Oscilloscope circuit
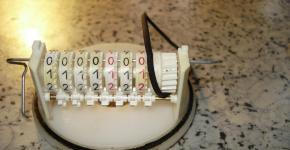
In Fig. Figure 2 shows an oscillogram of a signal with a frequency of 100 kHz. The variable resistor R6 shifts the scan line vertically, setting it to the most convenient position for observing the oscillogram. By selecting resistor R12, the best image contrast on the LCD screen is achieved.

Rice. 2. Oscillogram of a signal with a frequency of 100 kHz
The oscilloscope sweep operates in a single trigger mode by pressing the SB1 button. By pressing the SB2 button, the sweep duration is changed. After each press of this button, the value of the new sweep duration is displayed on the screen for some time (Fig. 3).

Rice. 3. The value of the new sweep duration
The microcontroller program can be downloaded.
Literature
1. Pichugov A. Pocket oscilloscope. - Radio, 2013, No. 10, p. 20, 21.
2.PIC18F2455/2550/4455/4550 Data Sheet. - URL: http://ww1.microchip.com/downloads/en/DeviceDoc/39632e.pdf (04/22/15).
3. Yatsenkov V. S. Microchip microcontrollers with hardware support for USB. - M.: Radio and communication, 2008.
4. TDA8708A. Video analog input interface. - URL: http://doc.chipfind.ru/pdf/philips/tda 8708a.pdf (05/21/15).
5. Liquid crystal module MT-12864J. - URL: http://www.melt.com.ru/files/file2150172.5.pdf (04/22/15).
6. Milevsky A. Using a graphical LCD MT-12864A with a microcontroller from Microchip. - Radio, 2009, No. 6, p. 28-31.
Publication date: 06.11.2015
Readers' opinions
- admin / 04/18/2017 - 14:35
The problem is on the FTP server, where the distribution is coming from. I think this is a temporary phenomenon, try downloading it a little later.